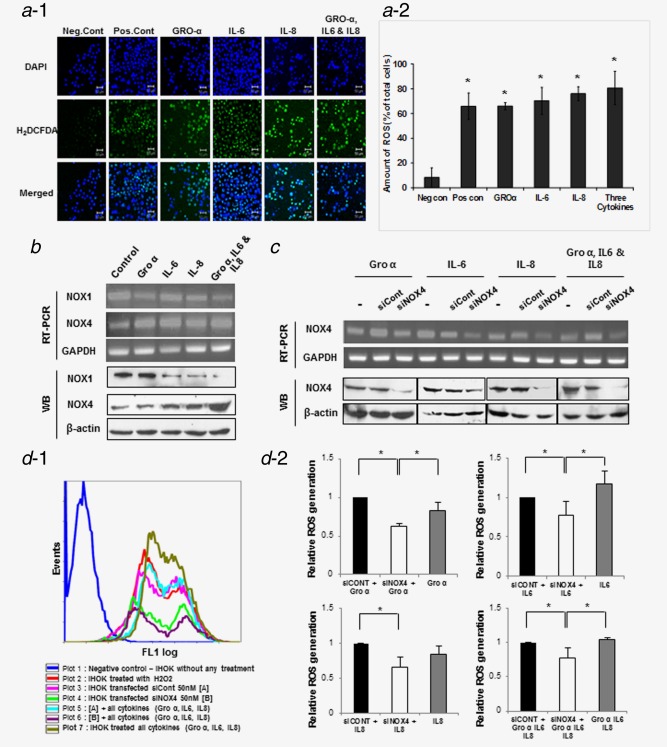
Figure 5.

Cytokines induced ROS production via NOX4 in IHOK. (a−1) ROS generation by cytokine treatment in IHOK was detected using H2DCFDA dye. IHOK were treated with cytokines individually (GRO‐α, IL‐6 and IL‐8) and in combination for 72 hr. Green fluorescent staining detected using confocal microscopy. (a−2) ROS‐generating cells were 7‐ to 8‐fold higher in cytokine‐treated IHOK than in nontreated cells (*p < 0.05 by Mann–Whitney U test). Representative photomicrographs shown. Scale bar 50 µm. (b) The expression of NOX1 and NOX4 was analyzed by RT‐PCR and Western blot. NOX4 was increased after stimulation with each cytokine and combined cytokine treatment for 72 hr in IHOK. (c) IHOK cells were transfected with NOX4 siRNA (siNOX4) 50 nM or control siRNA (siCont) 50 nM and stabilized for 24 hr. After stabilization, the cells were cultured with cytokine for 1 hr. Knockdown of NOX4 was accomplished as above and confirmed by RT‐PCR and Western blot. (d−1) Flow cytometry analysis of positive cell staining H2DCFDA dye for detection of ROS generation by NOX4 knockdown. (d−2) Graphs shown were as a quantitative analysis. Each of IHOK cell transfected with siCont (Black stick), siNOX4 (White stick) and the cell without any transfection (Gray stick) treated with indicated cytokine and then analyzed. In spite of cytokine treatment, NOX4 knockdown‐IHOK decreased ROS generation compare to cell transfected with siCont and cell without any transfection. The results shown are representative of multiple repeats (*p ≤ 0.05 by Mann–Whitney U‐test). [Color figure can be viewed in the online issue, which is available at wileyonlinelibrary.com.]
