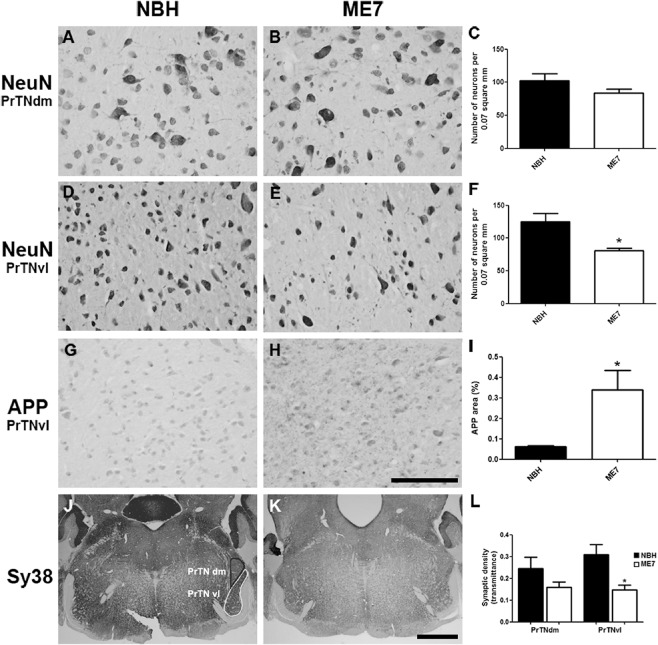
Figure 6.

Neuronal, APP and synaptic pathology in the principal trigeminal nucleus. (A–F) Micrographs illustrating NeuN labelling in PrTNdm and PrTNvl of NBH (A,D) and ME7 (B,E) animals, respectively. Masks used to quantify the number of neurons per area, generated in ImageJ software, are shown in supplemental material. ME7 induced significant neuronal loss in PrTNvl (F) but not in PrTNdm (C). *t‐test, P < 0.01. n = 7 ME7, n = 6 NBH. Scale bar: 100 μm. (G–I) Immunolabelling for APP in the PrTN of NBH (G) and ME7 (H). Greyscale images were treated to differentiate brown and blue labelling (see methods) and then thresholded in ImageJ software in order to quantifty APP deposits only. The percentage of APP‐labelled area in the PrTN of NBH and ME7 animals (n = 4 in each group) is shown in (I). *t‐test, P < 0.05. (J–L) Immunolabelling for Sy38 in PrTN of NBH (J) and ME7 animals (K). The regions of PrTN: ventrolateral part (in white) and dorsomedial part (in black) are delineated in (J). Contrast indices are shown for synaptophysin transmittance measurements in PrTNvl and PrTNdm of NBH (J) and ME7 (K) groups. Statistically significant reduction of synaptic density was found in PrTNvl, but not in PrTNdm (L). *t‐test, P < 0.01. PrTNVL, principal trigeminal nucleus, ventrolateral part; PrTNdm, principal trigeminal nucleus, dorsomedial part. n = 10 ME7 and 6 NBH. Scale bar: 1 mm. All data are shown as mean ± SEM.
