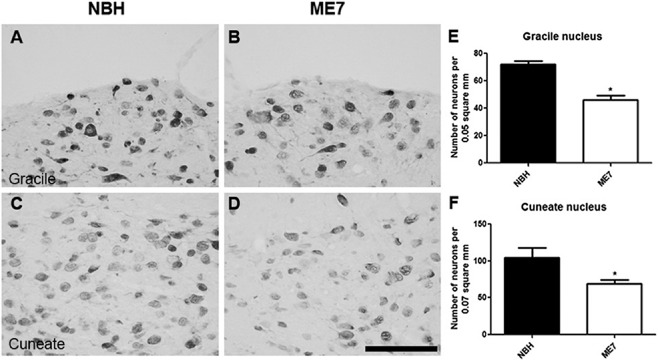
Figure 7.

Neurodegeneration in the gracile and cuneate nuclei. Immunolabelling for NeuN in gracile and cuneate nuclei of NBH (A,C) and ME7 (B,D). Both graphs for gracile (E) and cuneate (F) revealed statistically significant reduction of neurons in ME7 animals (t‐test, *P < 0.05; **P < 0.01). Data are shown as mean ± SEM with n = 4 in each group. Scale bar: 100 μm.
