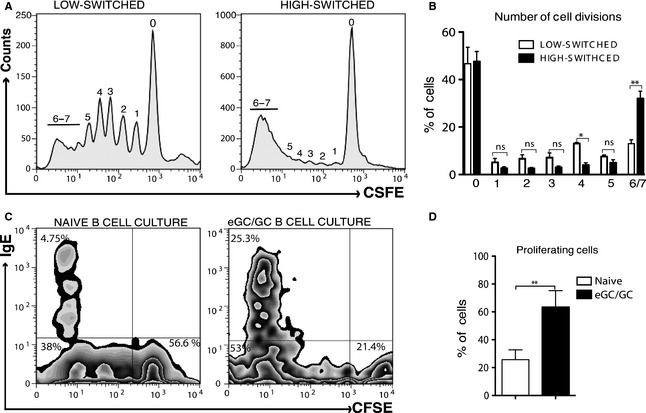
Figure 4.

The yields of IgE+ cells in IL‐4 and anti‐CD40 cultures are associated with the proliferative capacity of the cultured cells. (A) Division of cells from a representative low‐switched and high‐switched tonsil B‐cell culture as determined by the CFSE dilution, whereby each peak, as indicated by the numbers, represents successive cell divisions. Data are derived from the results on day 12 of cell culture and are representative of three experiments. (B) Percentage of cells at each divisional peak in the low‐ and high‐switched tonsil B‐cell cultures. Data are derived from the results on day 12 of cell culture and represent the mean of percentages ± SD of low‐switched (n = 3) and high‐switched (n = 3) B‐cell cultures. (C) FACS plots show the proliferative capacity of the sorted naïve and total GC (eGC and GC) B cells, as determined by the CFSE dilution, and the percentage of IgE+ cells, as determined by intracellular staining, on day 12 of the IL‐4 and anti‐CD40 cultures. (D) The summarized percentage of proliferating cells in the naïve and eGC/GC B‐cell cultures. Data are derived from the results on day 12 of cell culture and represent the mean of percentages ± SD of naïve (n = 4) and eGC/GC (n = 4) B‐cell cultures. Statistical analysis was performed using an unpaired two‐tailed t‐test (*P < 0.05, **P < 0.01).
