Figure 5.

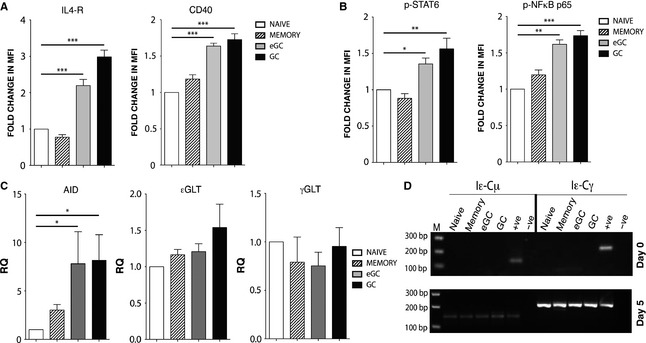
Enhanced IL‐4R and CD40 signaling in eGC and GC B cells. (A) IL‐4R and CD40 expression levels on tonsil B cells prior to culture with IL‐4 and anti‐CD40. Data show the percentage change in MFI of anti‐IL‐4R‐ and anti‐CD40‐stained cells relative to naïve B cells. (B) STAT6 and NFκB phosphorylation levels 24 h poststimulation with IL‐4 and anti‐CD40. Data show the fold change in MFI of anti‐p‐STAT6 (Tyr641)‐ and anti‐p‐NFκB p65 (Ser536)‐stained cells relative to naïve B cells. They represent the mean ± SD and are derived from three different tonsils. (C) RT‐PCR analysis of AID, εGLT, and γGLT expression 24 h poststimulation with IL‐4 and anti‐CD40. Data represent the mean ± SD of the relative quantification (RQ) and are derived from three different tonsils. (D) RNA was isolated from the sorted naïve, memory, eGC, and GC B cells on day 0 (preculture) and day 5 of cell culture with IL‐4 and anti‐CD40 antibody, The presence of Iε‐Cμ SCTs (167 bp; direct switching) and Iε‐Cγ SCTs (202 bp; sequential switching) was determined by nested PCR. Because of the nature of the nested PCR, the intensity of the PCR band does not necessarily reflect the amounts of switching occurring in our cultures. The positive control was cDNA from an IL‐4‐ and anti‐CD40‐stimulated tonsil B‐cell culture that yielded high percentages of IgE+ cells. The negative control was distilled H2O. Data are representative of three experiments. M = size marker, and bp = the size of the cDNA in base pairs (*P < 0.05, **P < 0.01, ***P < 0.001).
