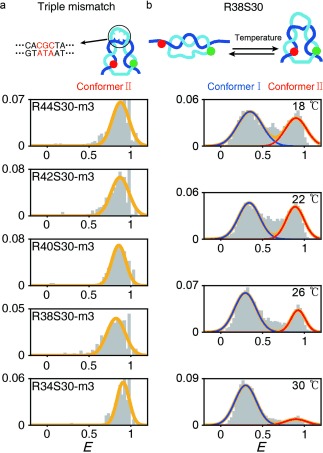
Figure 2.

The effect of mismatches and temperature on the two conformer populations. a) FRET efficiency histograms of the D‐samples with a triple mismatch at the center of the dsDNA portion. b) FRET efficiency histograms of R38S30 as a function of temperature. The subpopulation of the low FRET species (conformer I) increased as the temperature increased.
