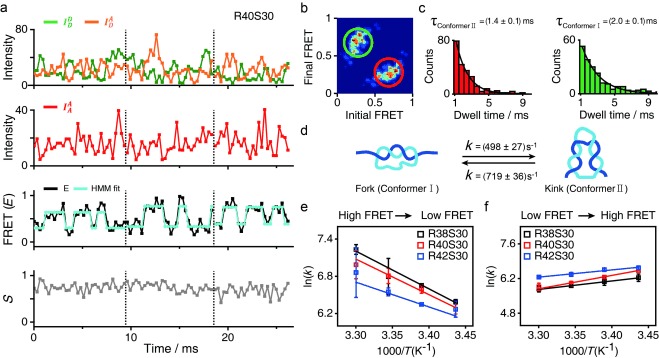
Figure 3.

Real‐time measurement of the D‐sample conformational dynamics under a strong bending force. a) Time traces of single diffusing D‐samples (R40S30) obtained using a high‐power laser with photo‐protection buffer. Three individual traces are displayed. Top panel: fluorescence intensity of the donor through donor excitation ( , green line) and fluorescence intensity of the acceptor through donor excitation (
 , orange line), which is a FRET signal. Second panel: fluorescence intensity of the acceptor through acceptor excitation (
 , red line), which indicates that the acceptor dye is present. Third panel: FRET efficiency (E) time traces with the HMM fitting curve, where two state transitions are shown. Fourth panel: time traces for the stoichiometry values (S) between the donor and acceptor. b) Transition density plot of the two main transitions between the E values of 0.25 and 0.70 obtained from the third panel of Figure 3 a (607 traces total). c) Dwell time (τ) distributions of conformer I and conformer II. The transition rate (1/τ) was obtained from the single exponential decay fit. d) The transition rates between the two d‐sample conformers. e–f) Arrhenius plot for the transition rate of d‐samples depending on the temperature: e) transition from conformer II to conformer I and f) transition from conformer I to conformer II. The activation energy barrier for the conformer II to conformer I transition was measured at (51±3), (48±5), and (33±7) kJ mol−1 for R38S30, R40S30, and R42S30, respectively.
