
Figure 4.
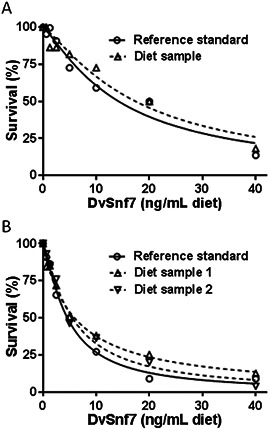
Concentration responses of reference standard DvSnf7 (solid circle) and the diet sample collected from the larval feeding test (A) and the adult feeding test (B) in 12‐d southern corn rootworm diet incorporation bioassays. Concentration–response curves were generated by plotting the percentage of survival against the concentration levels using GraphPad Prism 6. Median lethal concentration values and their associated 95% confidence intervals are presented in Table 1.