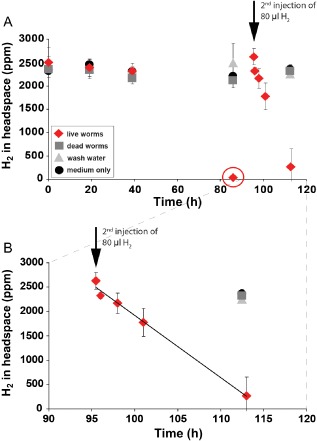
Figure 4.

H2 consumption by the O . algarvensis symbiosis.
A. H 2 consumption by live worms began only after 40 h and was then completely consumed within 86 h (circled in red) in all three replicates (standard deviations at this time point were so small that they are not visible in this figure). A second injection of 80 μl of H 2 to the incubations with live worms was monitored in shorter intervals and revealed a linear consumption of H 2 by the O . algarvensis symbiosis.
B. Close‐up of A after second H2 injection (at 95.5 h after begin of incubations). Linear consumption is emphasized by solid line (R 2 = 0.99). Mean values and standard deviations of three independent incubation bottles are plotted for each control and treatment.
