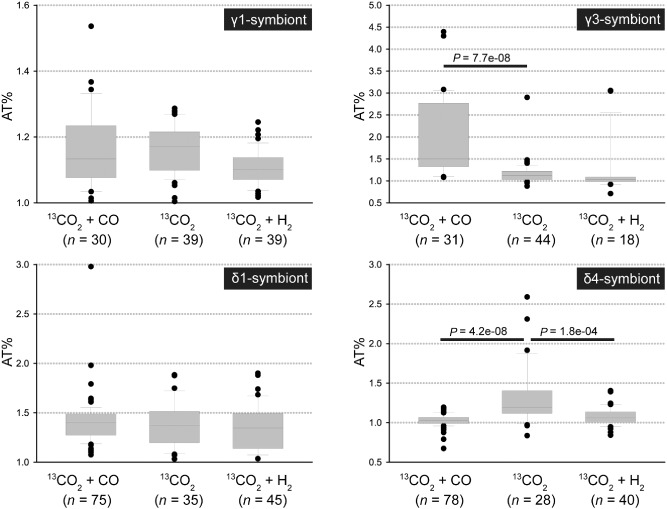
Figure 5.

13C‐content of single symbiont cells based on nanoSIMS analysis. For all symbionts and treatments cells from three worms were analysed except for the γ3‐symbiont in the H 2 treatment, for which only cells from two worms were analysed. Horizontal bars with P‐values indicate significant differences based on a Kruskal–Wallis test. Due to the different 13 C‐contents of the four symbionts we used different scales for the y‐axis for optimal visualization of the data. AT%: atom percent [13 C / (12 C + 13 C) × 100]; n: total number of symbiont cells analysed. 13 C isotope content values for all individual cells can be found in Table S1.
