
Figure 1.
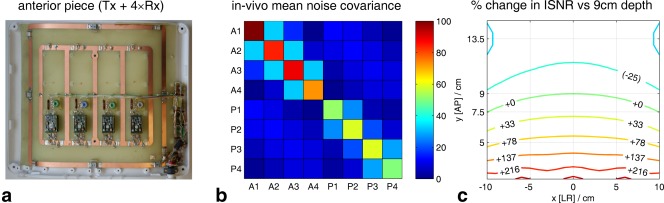
(a) Photograph of the anterior half of the eight‐element cardiac 31P 3T receive array coil employed in study. (b) Noise covariance matrix for this array. (Diagonal elements of the noise covariance matrix are the single‐coil noise variances. Note that this is not the same as the noise correlation matrix whose diagonal elements are all equal to 1 24.) (c) Contour plot of ISNR 24 in the midtransverse plane for the receive array with a 27‐cm separation between conducting elements. This plot is scaled relative to the interventricular septum (9‐cm depth). Horizontal lines mark the mean depth of the anterior mid‐short axis segments (7.5‐cm depth) and the inferior mid‐short axis segments (13.5 cm) across all subjects. A, anterior; ISNR, intrinsic signal‐to‐noise ratio; LR, left–right; P, posterior.