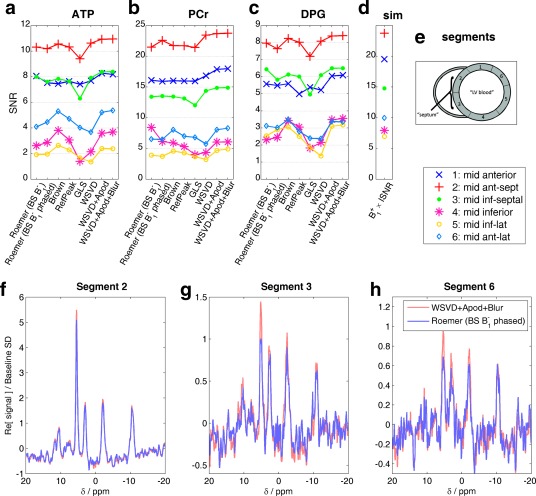
Figure 8.

Comparison of mean metabolite SNRs after application of different coil combination algorithms for five normal volunteers. (a–c) Points show mean metabolite SNRs (average of α‐ATP, β‐ATP, γ‐ATP peak SNRs, PCr SNR, and average of 2,3‐DPG peak SNRs) in each mid‐short axis myocardial segment for each coil combination algorithm. Lines are only to guide eye. (d) B1 + × ISNR at the mean centroid of each segment. This value should be proportional to SNR in the limit of low flip angle and long repetition time. (e) Inset showing segment numbering 48. (f–h) Example spectra from a voxel in the centre of each segment combined with the best data‐driven and the best field map‐driven algorithms. Apod, apodized; BS, Biot‐Savart law; GLS, generalized least squares; PCr/ATP, phosphocreatine to adenosine triphosphate concentration ratio; DPG, 2,3‐diphosphoglycerate; SD, standard deviation; SNR, signal‐to‐noise ratio; WSVD, whitened singular value decomposition.
