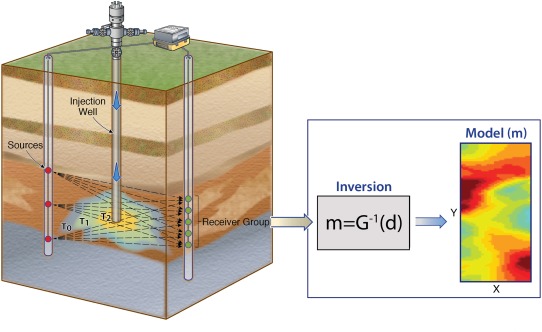
Figure 3.

Schematic representation of geophysical data inversion. The region of interest is investigated through the measurement of responses to signal sources recorded on a number of receiver sensors. The region is discretized into a series of geophysical model parameters (m) that are consistent with the data (d) through some inverse function (G−1). (left) Changes in subsurface states at different times (T0, T1, and T2), which may represent evolution of a remediation process or contaminant plume. (right) The geophysical image represents a snapshot of the distribution of a geophysical property at a particular time.
