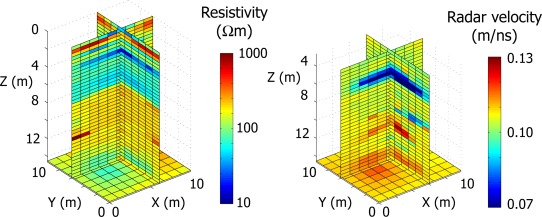
Figure 4.

Example joint inversion of cross‐well ERT and GPR data in the unsaturated zone of a sandstone aquifer (modified after Linde et al. [2006]). The 3‐D volume contains regions where electrical conductivity (from cross‐well ERT) and relative permittivity (from cross‐well GPR) follow different joint relationships, which Linde et al. [2006] quantified to propose four lithological units.
