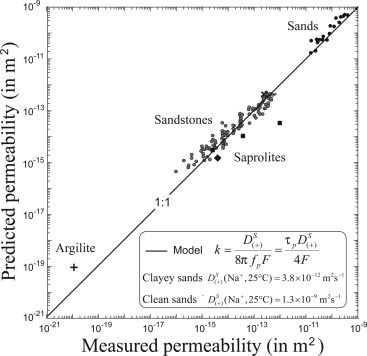
Figure 7.

Comparison of permeability (k) modeled from SIP measurements of an electrical time constant ( ) or relaxation frequency (fp) and measured permeability (modified from Revil [2013]). Here is the diffusion coefficient of cations in the Stern layer of the electrical double layer, and F is the formation factor.
