
Figure 1.
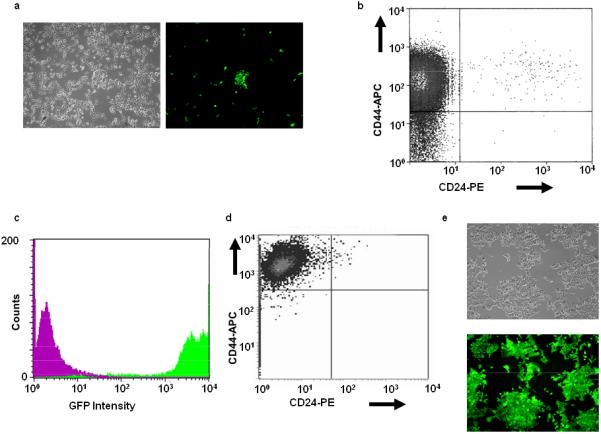
Characterization of Oct3/4-GFP-transfected MCF7 cells. MCF7 cells were transfected with a linearized plasmid encoding GFP under the control of the 4.0 kb Oct3/4 promoter and a G-418 resistance cassette [39]. (A): After selection in G-418, the same field of cells was visualized by light or UV microscopy (left and right panels, respectively). Note that only a small minority of cells were GFP+. (B): GFP+ cells (ca. 1% of the entire population) were isolated by FACS from the population shown in (A), briefly expanded, and then evaluated for CD44/CD24 expression. Note the predominantly CD44hi/CD24lo phenotype. (C): In the reciprocal experiment, CD44hi/CD24lo cells from (A) were isolated by FACS, expanded briefly, and then examined for the expression of GFP. Note the high-level expression of GFP (green curve) compared to that of a control CD44hi/CD24lo-depleted population (magenta curve). (D): Repeat analysis of the originally isolated GFP+ population from (B) performed six months later. (E): Light and UV microscopy of the cells from (D) showing essentially100% GFP positivity.