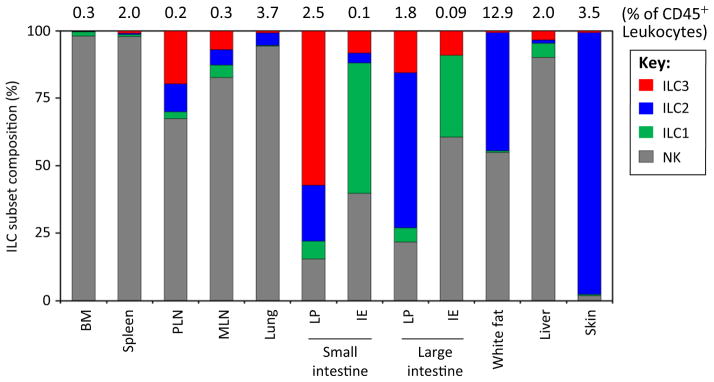
Figure 1.
Tissue Distribution of ILC Subsets. Average percent frequencies of NK, ILC1, ILC2, and ILC3 in total ILCs in indicated tissues of C57BL/6 mice are shown (n ≥ 4; 7–10 weeks of age). Total ILC frequencies among CD45+ leukocytes are also shown. NK cells were identified based on CD3−CD19−CD127−NKp46+NK1.1+ (most tissues), CD3−CD19−RORγt−NKp46+NK1.1+ (intestinal LP), or CD3−CD19−CD127−RORγt−NKp46+NK1.1+ Eomes+ (IE) phenotype as described before [17,36]. ILC1 were identified by Lin−RORγt−CD127+NKp46+NK1.1+ (most tissues) or Lin−RORγt−CD127−NKp46+NK1.1+ (IE) phenotype as described before [17,18,36]. ILC2 were identified by Lin−CD127+CD90+KLRG1+GATA3+ (most tissues), Lin−CD90+CD25+GATA3+ (spleen and skin), or Lin−CD127+CD90+T1/ST2+GATA3+ (lungs and WAT) phenotype [10,20,37,47,93]. ILC3 were identified by Lin−GATA3−CD127+CD90+RORγt+ phenotype [20]. ILC3 subsets within the total ILC3 group were not examined separately. The ILC1 population in the bone marrow includes ILC1 progenitors. Abbreviations: BM, bone marrow; IE, intraepithelial compartment; ILC, innate lymphoid cell; LP, lamina propria; MLN, mesenteric lymph node; NK, natural killer cell; PLN, peripheral lymph node (inguinal LN).

