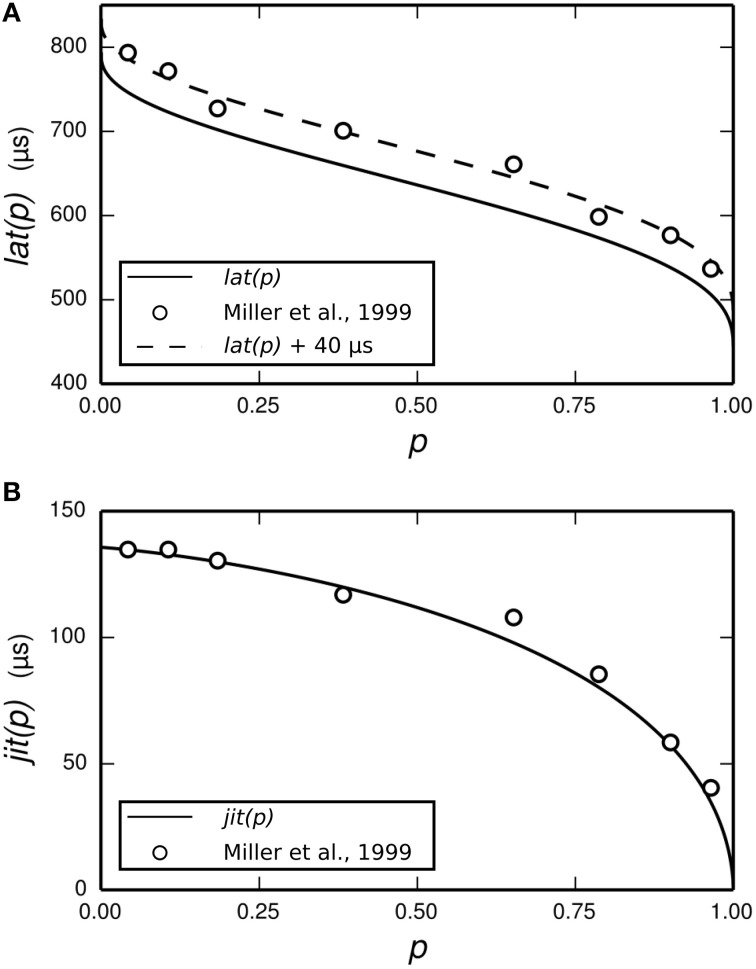
Figure 3.
Parameterization of the functions lat (solid line, A) and jit (solid line, B) from empirical data. The function lat is fitted to the mean latency of an ANF's response to a 40 μs monophasic pulse (Miller et al., 1999; open circles, A). The action potential initiation period is assumed to begin at the time of stimulus cessation, and so lat is chosen to under-predict the data by 40 μs. We have also plotted lat+40 μs (dashed line, A) to better show the fit to data. The function jit is fitted to the jitter of the same ANF's response to the same stimulus (Miller et al., 1999; open circles, B).

