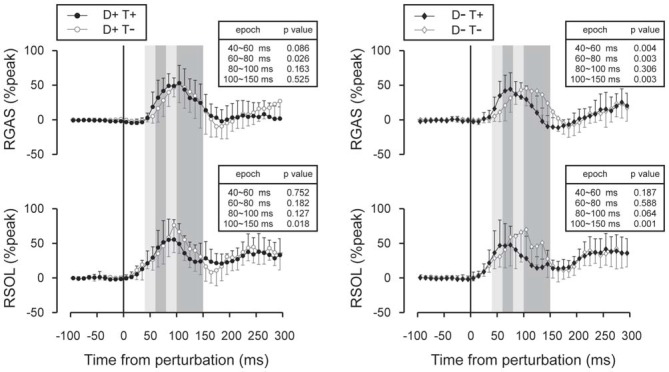
Figure 7.

Subtracted EMG signals in acceleration perturbation trials. Mean and standard deviations among all participants are illustrated. GAS responses were shifted to earlier latencies with prior temporal knowledge for the perturbation. Error bars show standard deviations. The mean amplitude was compared by using paired t-tests for four time window: 40~60 ms, 60~80 ms, 80~100 ms and 100~150 ms.
