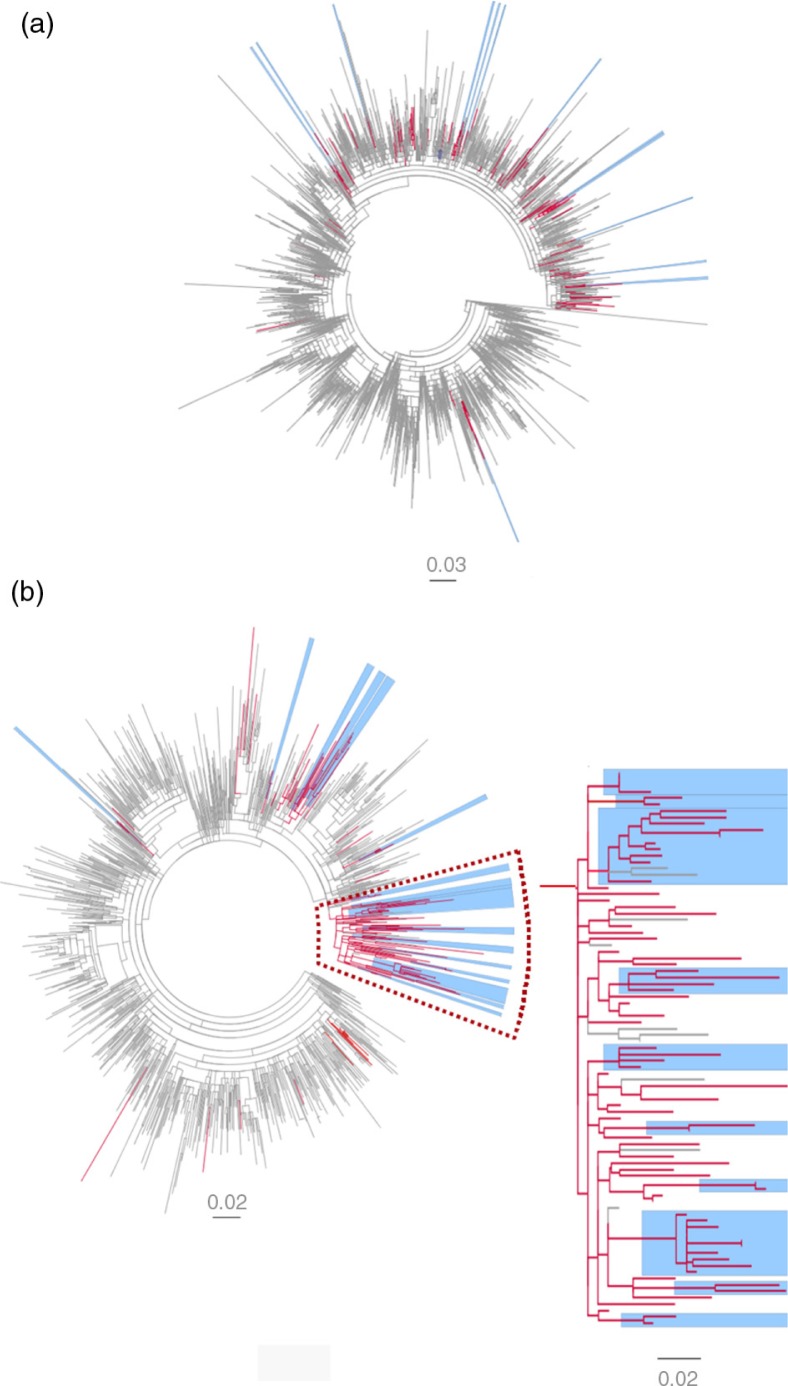
Fig. 2.
Maximum likelihood phylogenetic analysis of NS5B sequences of subtype 1a and 3a. (a) Subtype 1a and (b) subtype 3a and a zoom-in of a large non-supported cluster N=74 (aLRT-SH=0.8), including 10 of 17 3a D-county clusters (five dyads and five networks with high statistical support (aLRT-SH >0.85). The tree is displayed as midpoint rooted. Branches in red denote Swedish sequences from D-county– 1a: N=122 (2002–2009), N=23 (1991–2001), and 3a: N=115 (2002–2009), N=25 (1991–1999). Branches in gray denote all overlapping reference sequences from GenBank (1a: N=2493 and 3a: N=998) originating from 38 and 32 countries, respectively, worldwide. The Swedish D-county clusters: dyads (two sequences) and networks (3–10 sequences) are highlighted in blue (SH-aLRT >0.85).

