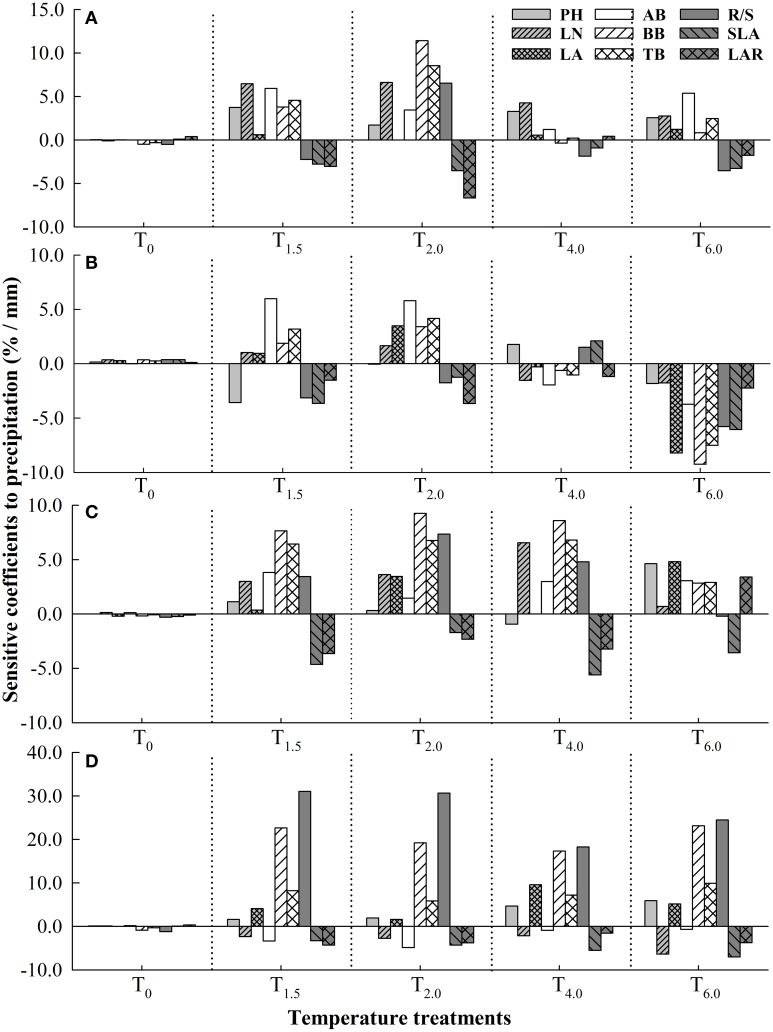
Figure 1.
Sensitivity coefficients of plant functional traits to precipitation under different temperature treatments in four Stipa species. (A) S. baicalensis, (B) S. grandis, (C) S. breviflora, (D) S. bungeana. T0, T1.5, T2.0, T4.0, T6.0 denote increasing temperature by 0°C, 1.5°C, 2.0°C, 4.0°C, and 6.0°C, respectively, relative to mean temperature at the local site over 30 years (1978–2007).

