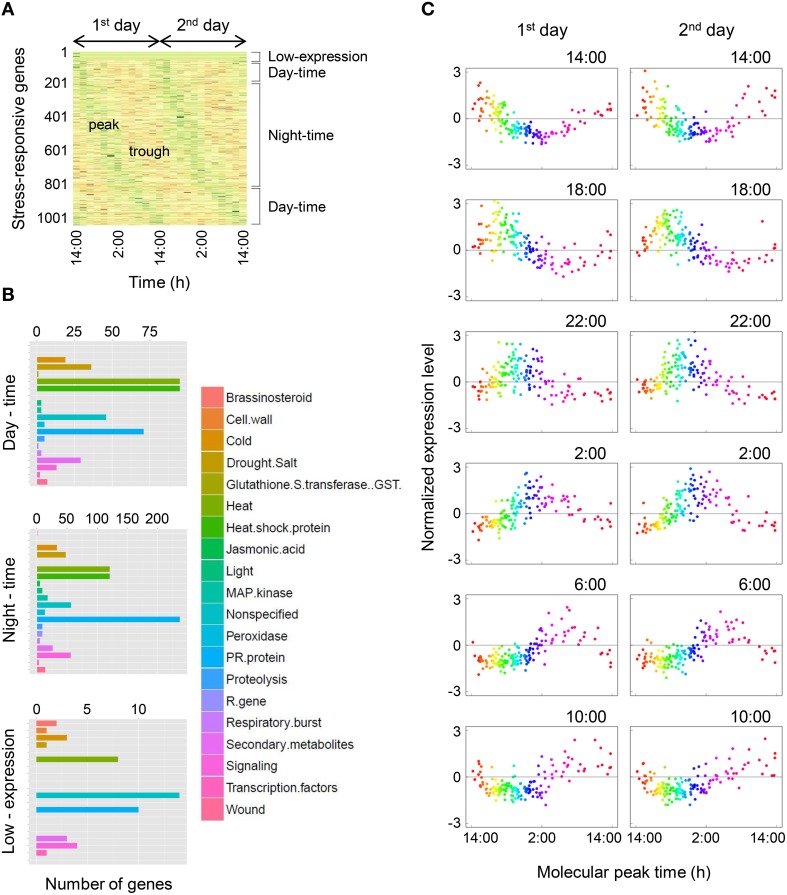
Figure 4.
Diurnal gene expression profiles of stress-responsive genes. (A) Oscillation behavior of stress-responsive genes. Green areas indicate the peak and red areas indicate the trough. (B) Categorization of stress-responsive genes using MapMan. Day-time was 7:00–17:00 (10 h) and night-time was 17:00–7:00 (14 h). (C) Expression profiles of 150 time-indicating genes for the 1st and 2nd days in stress-responsive genes. The time at the top right of the plot area indicates the sampling time. The range from orange to purple represents night-time and other colored areas represent day-time.

