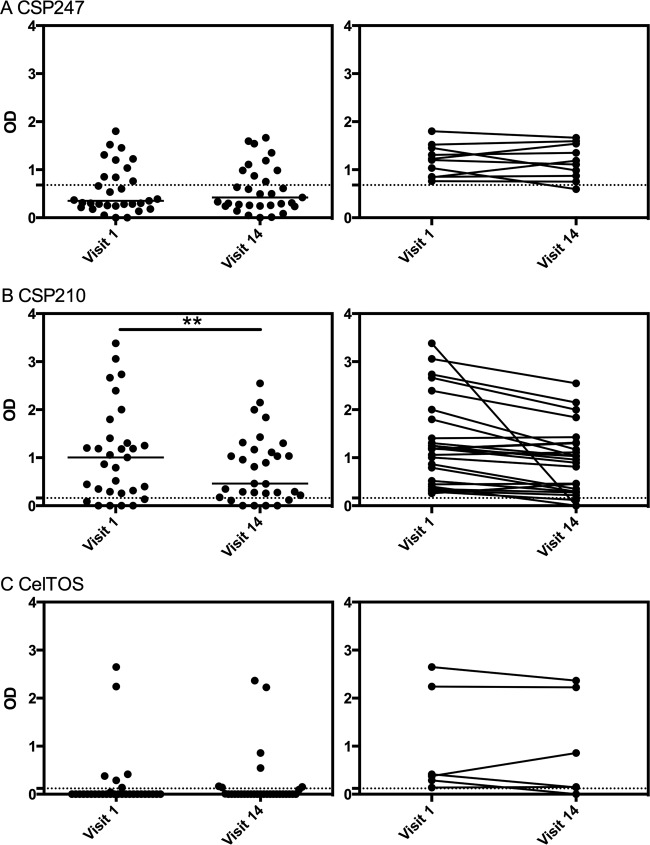
FIG 4.
Longevity of the IgG magnitude in exposed volunteers. IgG responses to P. vivax (A) CSP247, (B) CSP210, and (C) CelTOS in the 31 exposed volunteers were stratified by visits 1 and 14. The left panels show individual data points and the median, while the right panels show the individual change over time for individuals who were seropositive. The dashed lines represent protein-specific positivity cutoffs. Statistical difference over visits was assessed using the Wilcoxon matched-pairs signed-rank test: (A) P > 0.99, (B) P = 0.0014, and (C) P = 0.77.

