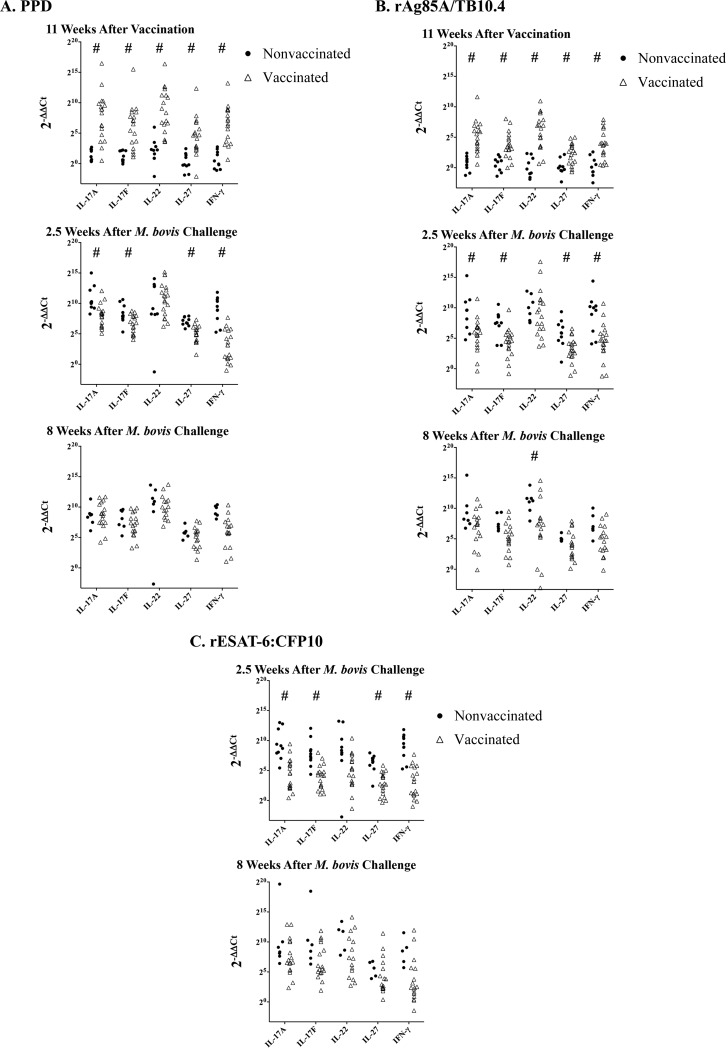
FIG 1.
Antigen-specific gene expression of Th17-associated cytokines in response to vaccination and subsequent challenge with virulent M. bovis. Relative gene expression levels were calculated using the 2−ΔΔCT method, using nonstimulated cells as the calibrator and eukaryotic 18S rRNA as the endogenous control. Data are presented as individual animal responses to PPD (A), rAg85A-rTB10.4 (B), or rESAT-6:CFP10 (C) in nonvaccinated animals and vaccinated animals, at the indicated time points. Responses did not differ (P > 0.05) between animals vaccinated with BCG mutants versus BCG; thus, these two groups were pooled as vaccinated. #, responses differ between nonvaccinated animals and vaccinated animals for the respective cytokine (P < 0.05, Student's t test, using ΔΔCT values for comparisons).

