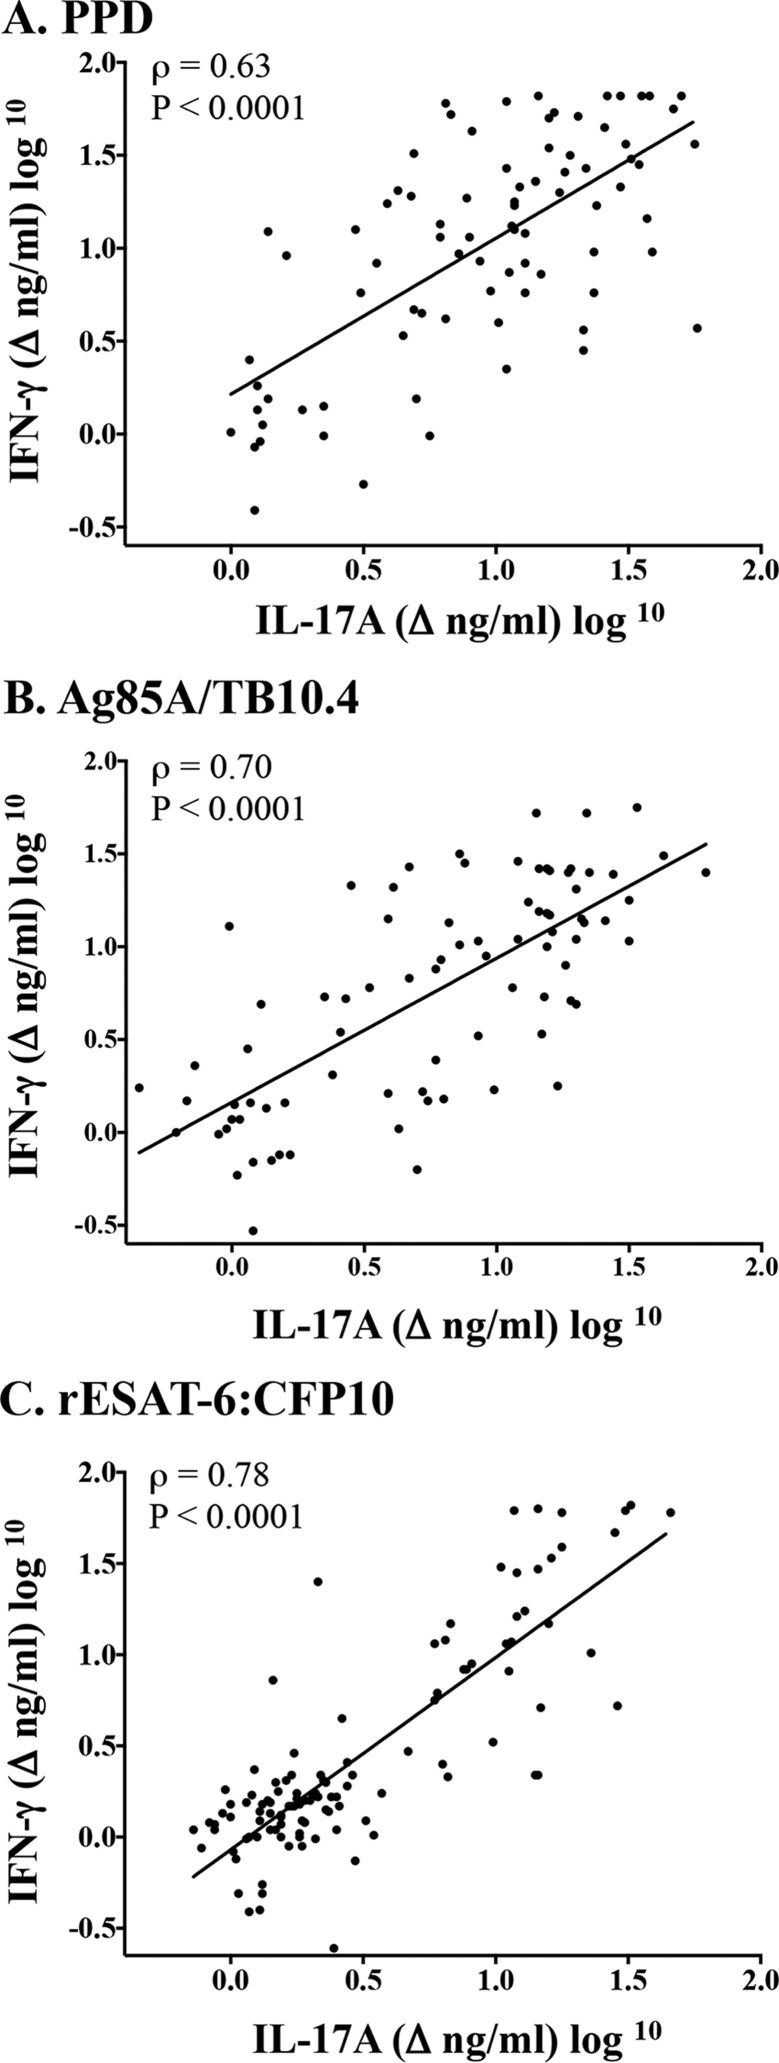
FIG 4.
Correlation of IL-17A and IFN-γ responses. Treatment groups included nonvaccinated animals (n = 10), BCG-vaccinated animals (n = 9), and animals vaccinated with BCG mutants (i.e., BCG Δfdr8, BCG ΔleuCD Δpks16, BCG ΔmetA, and BCG ΔmmaA4) (n = 10). Virulent M. bovis strain 10-7428 was administered by aerosol to all calves 3.5 months after vaccination, and calves were euthanized 4.5 months after challenge (Table 1). Whole blood was collected into heparinized tubes from all calves 11 weeks after vaccination, 2.5 weeks after M. bovis challenge, and 10 weeks after M. bovis challenge and were stimulated with 20 μg/ml M. bovis PPD (Lelystad; Prionics Ag) (A), 1 μg/ml rAg85A-rTB10.4 (B), 1 μg/ml rESAT-6:CFP10 (C), or medium alone (no stimulation) for 16 h at 39°C, and plasma was harvested for IFN-γ and IL-17A analyses using ELISA kits (Bovigam [Prionics Ag] and bovine IL-17A ELISA VetSet [Kingfisher Biotech]). Data represent the changes in nanograms per milliliter (log10) (i.e., antigen stimulation minus medium alone) for IFN-γ versus IL-17A responses for each individual animal at each time point (n = 87). Prior to analysis and graphing, data were transformed for positive skewness with zero values using the following formula: new x = log10(x + 1).

