
FIG 2.
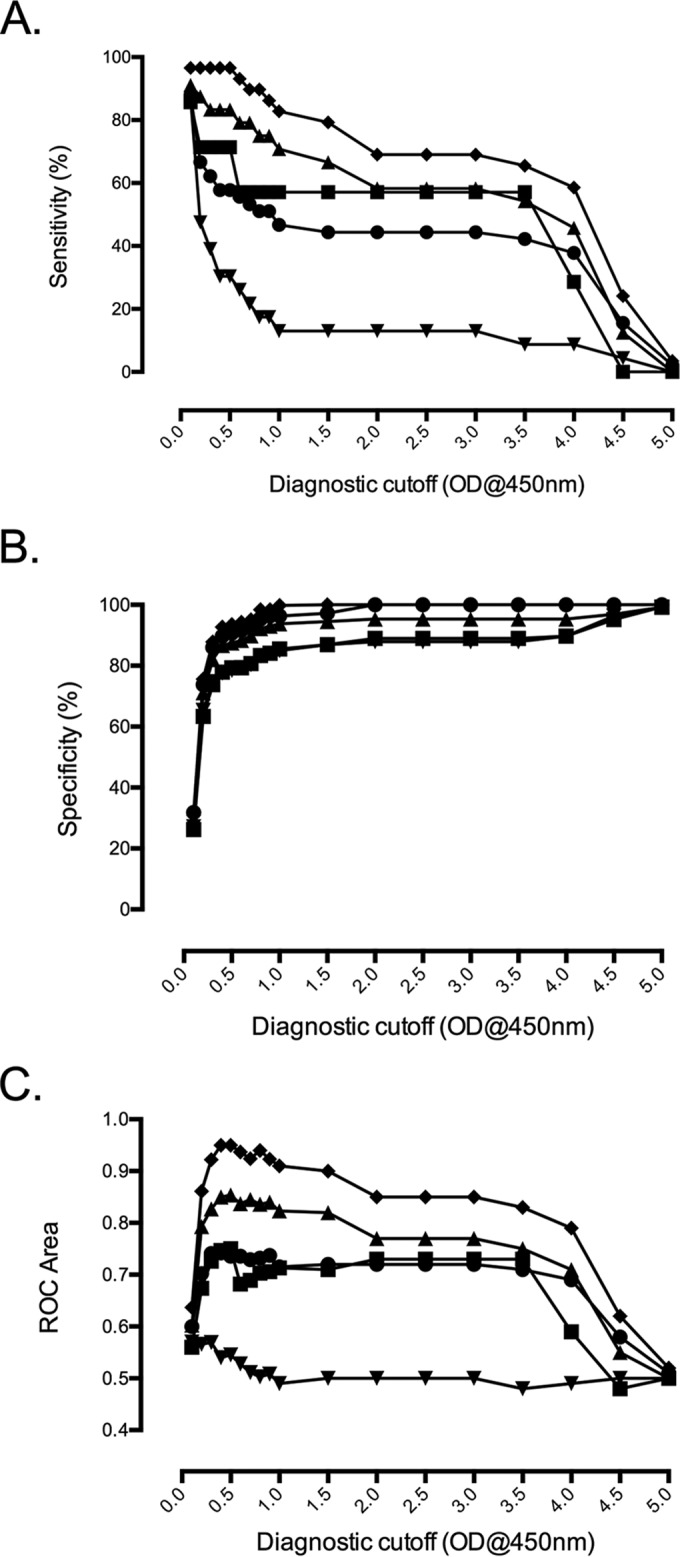
Overview of ELISA diagnostic cutoff ODs plotted for various diagnostic modalities. Sensitivity (A), specificity (B), and ROC area compared with ELISA diagnostic cutoff OD at 450 nm for various diagnostic modalities (C). ●, STIC; ■, IVI; ⬥, PCR; ▲, 4-fold increase IgM IFA in paired samples plus IgM IFA admission of ≥1:3,200; ▼, 4-fold increase IgM IFA in paired samples.