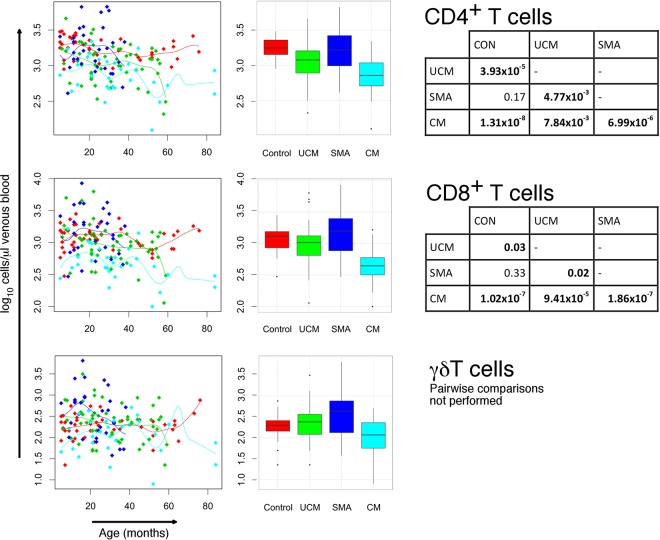
FIG 2.
Absolute T lymphocyte subset counts (CD4+, CD8+, and γδ+ T cell) in children with cerebral malaria (CM), severe malaria anemia (SMA), or uncomplicated malaria (UCM) and aparasitemic children. CD4+, CD8+, and γδ+ T cell counts in peripheral blood at acute presentation with CM (turquoise), SMA (dark blue), or UCM (green) compared with healthy children (red). Counts shown for individual children against age with nonparametric regression line (left column) and box-and-whisker plots (middle column; boxes, interquartile ranges; whiskers, data ranges excluding outliers). Tables (right column) give Dunn's pairwise post hoc statistical comparisons of groups where Kruskal-Wallis and nonparametric ANCOVA comparisons of data across groups gave P values of <0.05. All P values were adjusted with Benjamini-Hochberg corrections for multiple comparisons.

