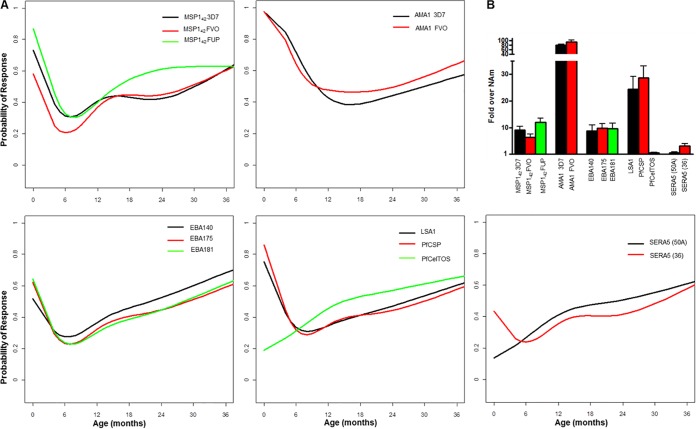
FIG 1.
Serological responses in infants over time. (A) Detection probability (y axis) of each antibody in infants over time (x axis). Responses to specific antigens are indicated in each plot box. (B) Magnitude of antibodies in cord blood for each indicated antigen expressed as fold increase relative to negative-control North Americans (NAm) (mean + standard error of the mean).

