FIG 2.
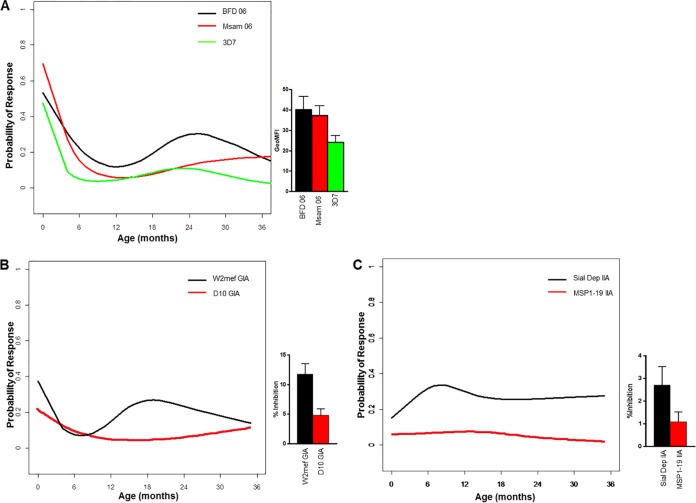
Infant VSA, GIA, and IIA antibodies over time. (A) Detection probability (y axis) of each VSA measured antibody response in infants over time (x axis). VSA responses to each P. falciparum isolate are indicated. Bar graph to the right of the plot shows the geometric mean fluorescence intensity (GeoMFI) for VSA antibodies in cord blood (mean + standard error of the mean [SEM]). (B) Detection probability (y axis) of W2mef and D10 GIA antibody responses in infants over time (x axis). Bar graph to the right of the plot shows the percentage of growth inhibition of GIA responses in cord blood (mean + SEM). (C) Detection probability (y axis) of Sial Dep and MSP1-19 IIA antibody responses in infants over time (x axis). Bar graph to the right of the plot shows the percentage of invasion inhibition responses in cord blood (mean + SEM).

