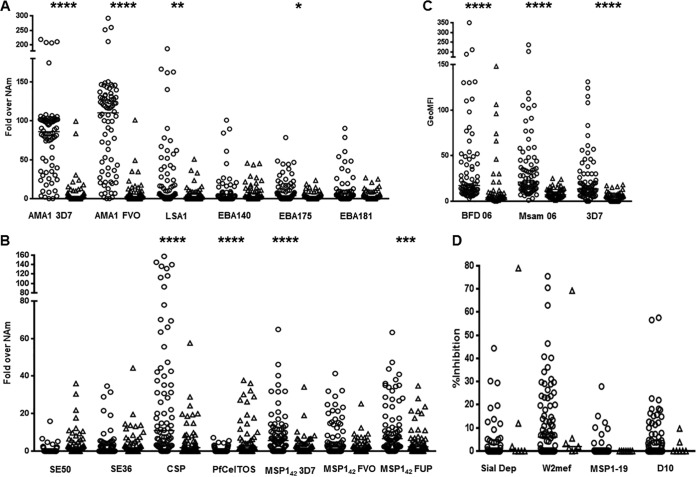
FIG 3.
Antibodies in cord blood (open circles) compared to 36-month-old young children (open triangles). Dot plots of serologic antibody responses (fold increase relative to North Americans [NAm]) to specified antigens measured in cord blood and 36-month-old young children (A) and to another set of antigens measured in cord blood and 36-month-old young children (B). Note the smaller y axis in (B) than in (A). (C) GeoMFI of VSA responses measured in cord blood and 36-month-old young children. (D) Percent growth inhibition of GIA and IIA antibody responses measured in cord blood and 36-month-old young children. *, P = 0.04; **, P = 0.0005; ***, P = 0.0002; ****, P < 0.0001; horizontal bar when visible represents median values.

