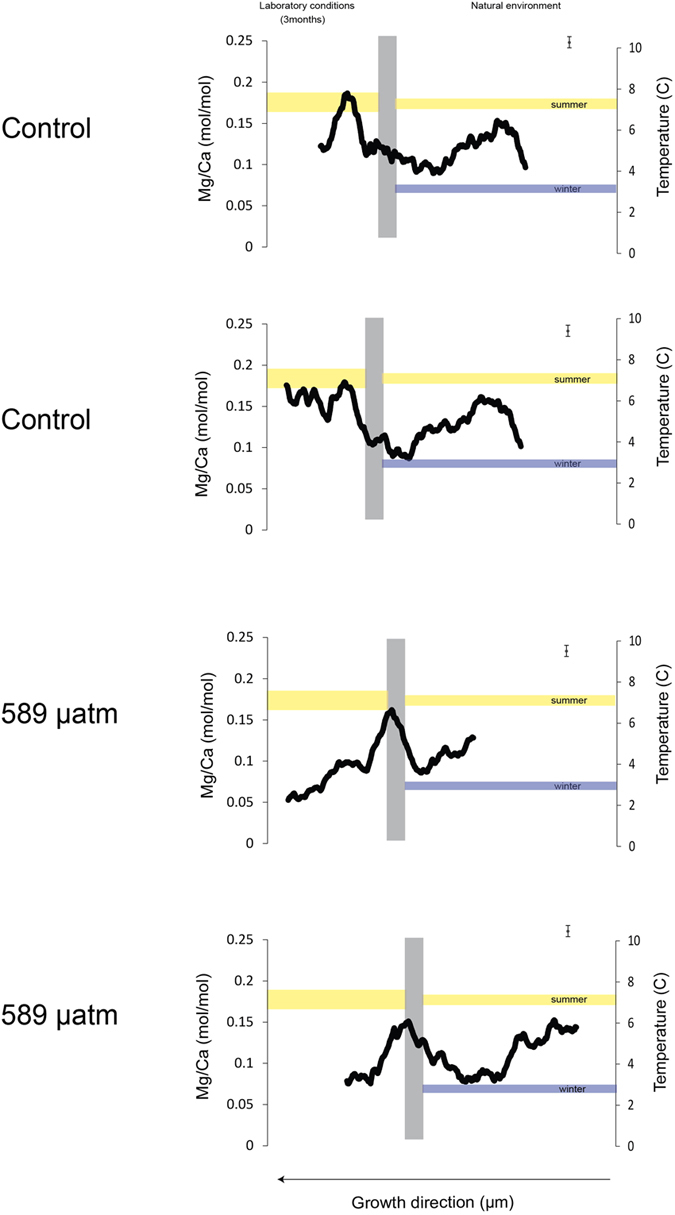
Figure 1. Two Mg/Ca (mmol/mol) transects for each sample were measured using EMPA.

The data is represented as a 30 point moving average. Error bars in the top right corner of each graph indicate the uncertainty based on the counting statistics. The grey line demarks the Alizarin staining at the beginning of the experiment. Data left of the line represents growth under laboratory conditions while data right of the graph shows growth in the natural environment. Reconstructed temperature (°C) is shown on the secondary vertical axis using L. glaciale temperature equation from Kamenos et al. 2008. The yellow horizontal band indicates the culture temperature of the aquaria (7 ± 0.5 °C), the thin lines indicate the seasonal temperate range at the collection site.
