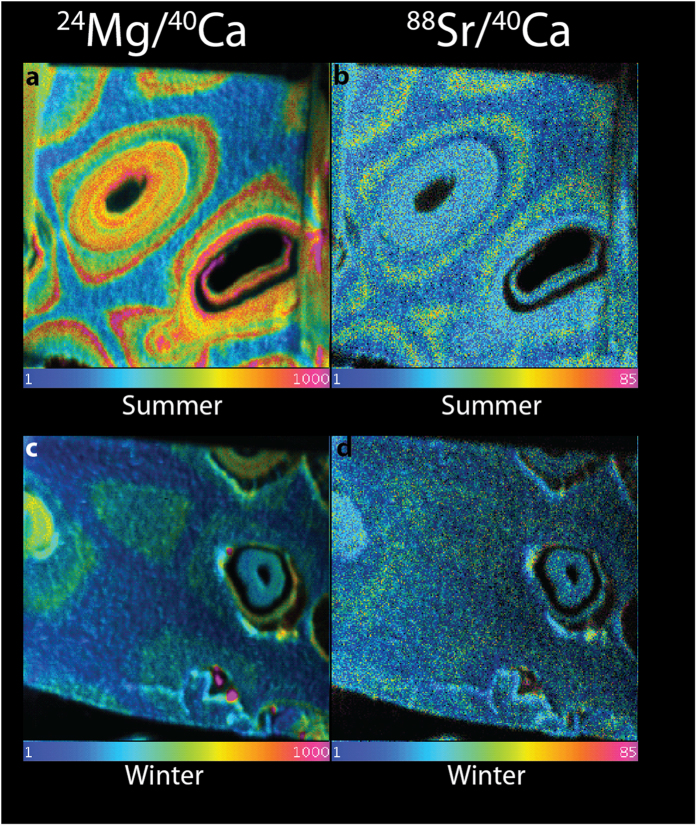
Figure 2.
NanoSIMS ratio images of Mg/Ca (left) and Sr/Ca (right) of natural growth in the summer (a,b) and winter (c,d). The field of view is 20 × 20 um. Note the pronounced banding in both Mg and Sr in the summer samples (top) versus the lower concentrations and less pronounced banding in the winter sample (bottom). The colour scheme represents the ratio of Mg and Sr to Ca, respectively. Blue represents a ratio of 0.0001 Mg/Ca and magenta a ratio of 0.1 for Mg, and 0.0001 and 0.0085 for Sr.

