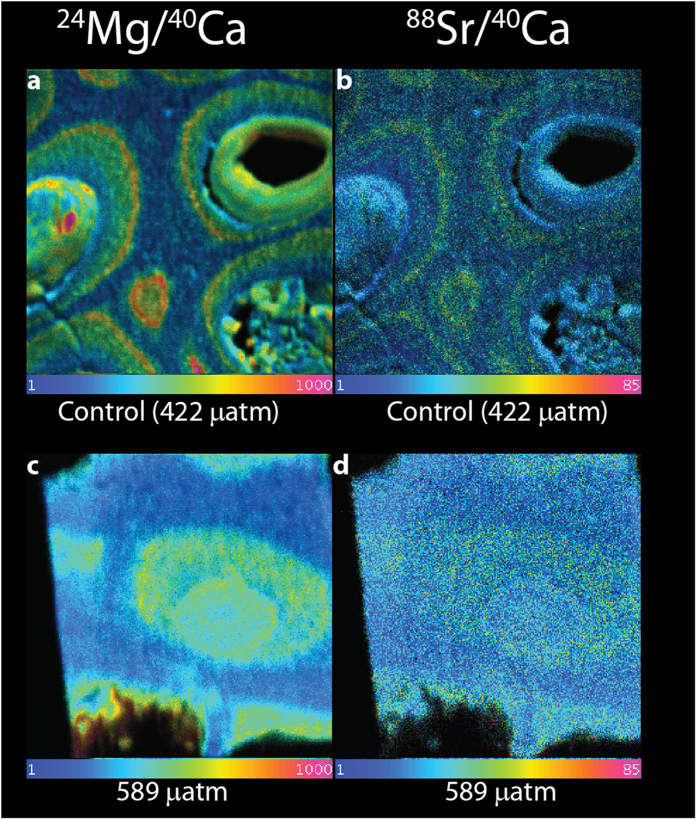
Figure 3.
NanoSIMS ratio images of Mg/Ca (right) and Sr/Ca (left) ratios of material deposited during the culturing experiment under (a,b) control CO2 (422 μatm) conditions (top) and (c,d) acidified conditions (589 μatm, bottom). Note the similarity of the banding in the control experiment and natural summer growth (Fig. 4 top) and the distinct loss of banding and overall lower concentrations in the material grown under acidified conditions. The field of view is 20 × 20 um. The colour scale is the same as Fig. 3.

