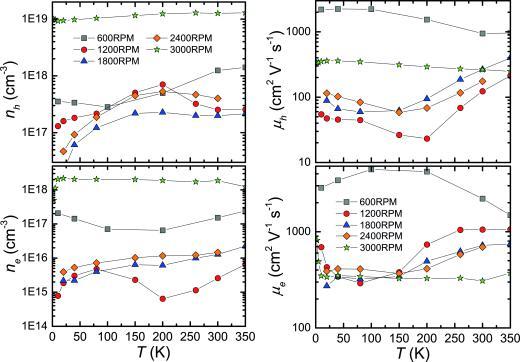
Figure 12.

Results of a two‐band Hall effect analysis evaluated using Equations (5)–(10). The left panel shows the temperature dependencies of the charge carrier concentrations of all investigated CoSb3 samples within the individual bands, the right panel the corresponding temperature dependencies of the Hall mobilities.
