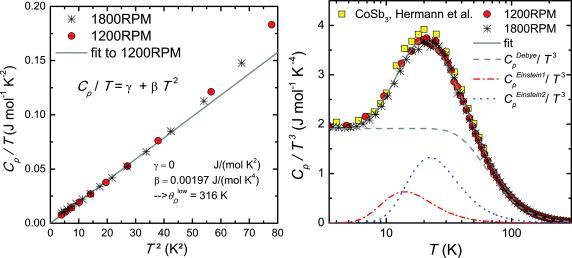
Figure 6.

Heat capacity C p over temperature T vs. T 2 (left) for 1200RPM (red circles) and 1800RPM (black stars). From the linear fit (gray line) to the data of 1200RPM, γ and β were determined. The right panel shows C p over T 3 of 1200RPM (red circles), 1800RPM (stars), and literature data from Ref. 15 vs. T on a logarithmic scale. The gray solid line is a fit according to a mixed Debye‐Einstein model [Equation 4], the dashed lines show the Debye (dashed gray line) and the Einstein contributions (dash‐dotted red and dotted blue line).
