Figure 8.

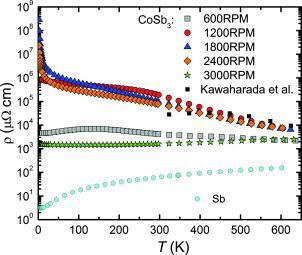
Electrical resistivity of all meltspun and SPS treated CoSb3 samples as a function of temperature. The black squares are literature data for polycrystalline CoSb3,16 the cyan hexagons show data on polycrystalline Sb.

Electrical resistivity of all meltspun and SPS treated CoSb3 samples as a function of temperature. The black squares are literature data for polycrystalline CoSb3,16 the cyan hexagons show data on polycrystalline Sb.