
Figure 2.
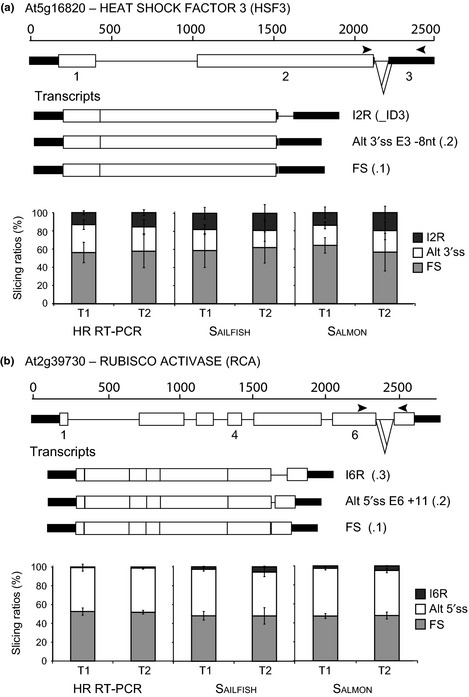
Arabidopsis thaliana gene and transcript structures and histograms of transcript ratios from transcripts per million (TPM) generated by Sailfish and Salmon with Arabidopsis reference transcript dataset (AtRTD) and from relative fluorescence units (RFUs) that measures peak areas from high resolution reverse transcription polymerase chain reaction (HR RT‐PCR. (a) At5g16820, HEAT SHOCK FACTOR 3 (HSF3); (b) At2g39730, RUBISCO ACTIVASE (RCA). Transcripts are shown below the gene structure. Open boxes, exons; black rectangles, untranslated regions; thin lines, introns; diagonal lines, splicing events; arrowheads, approximate positions of primers used in HR RT‐PCR. FS, fully spliced; E, exon; I2R/I6R, intron retention of introns 2 and 6 in (a) and (b), respectively; Alt 3′/5′ss, alternative (a) 3′ and (b) 5′ splice sites, respectively; T1 and T2, different time‐points. Transcript variants from The Arabidopsis Information Resource (TAIR) and the alternative splicing (AS) discovery dataset (Marquez et al., 2012) are indicated by .1, .2, or _ID3, respectively. Error bars represent the ± standard deviation (SD) of three independent biological replicates.