
Figure 3.
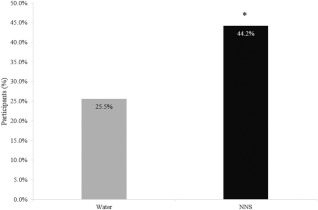
Percentage of participants who achieved at least 5% weight loss. Results based on χ 2 analysis. Analysis includes those participants who dropped out of the study, using the baseline observation carried forward. This analysis mimics the clinical setting. Difference = 0.1865 or 18.65% difference between groups with 90% CI (0.1065‐0.2735), n = 154 for NNS, n = 149 for water. *P < 0.001.