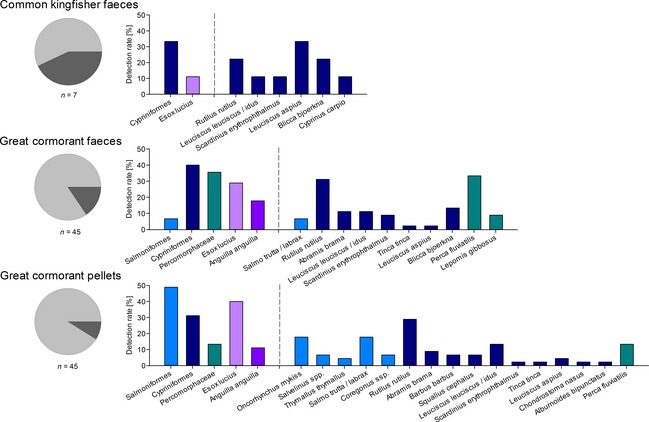
Figure 4.

Fish DNA detected in field‐collected faeces (Common Kingfisher, Great Cormorant) and pellets (Great Cormorant) via the multiplex PCR system. Pie charts display the percentage of positive (light grey) and negative (dark grey) samples with amplifiable fish DNA, whilst bar charts show detection rates (%) per target taxon within the FishTax and the follow‐up assays left and right of the dotted line, respectively. Note that species‐specific bars do not add up to the detection rate at family level as one sample can test positive for more than one species.
