
Figure 1.
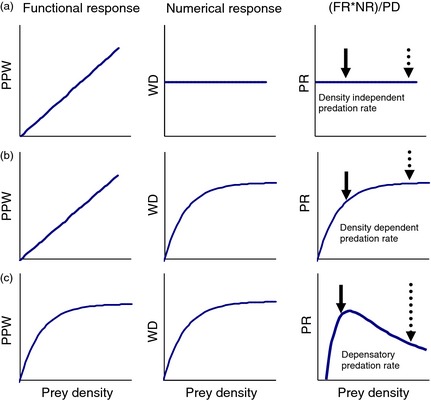
Predation‐related hypotheses of the moose decline based on different predation rates (PR), generated from varying the form of the functional (FR) and numerical response (NR). PPW is prey consumed per wolf, and WD is wolf density (see text for details). (a) a Type I FR and Type 0 NR yields a density‐independent PR; (b) a Type I FR and Type II NR yields a density‐dependent PR; and (c) a Type II FR and Type II NR can transition from a depensatory PR to a density‐dependent PR. Scenario (b) can also be achieved by reversing the forms of the FR and NR (i.e. a Type II FR and Type I NR). Dotted and solid arrows, respectively, indicate the hypothetical moose population at the beginning and latter part of the moose reduction. Modified from Holling (1959b).