Figure 1.

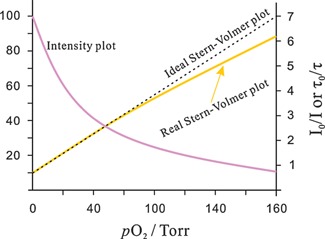
Intensity plot of the quenching of luminescence intensity by oxygen, and respective Stern–Volmer plot. The y‐axis on the left side gives relative intensity units. The y‐axis on the right refers to the Stern–Volmer plot.

Intensity plot of the quenching of luminescence intensity by oxygen, and respective Stern–Volmer plot. The y‐axis on the left side gives relative intensity units. The y‐axis on the right refers to the Stern–Volmer plot.