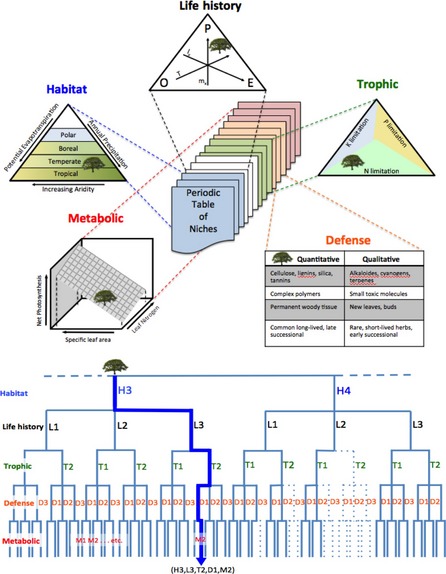
Figure 3.

Illustration of the multidimensional nature of a periodic table of niches based on (a) relative position of a hypothetical tree species within ordination schemes for habitat, life history, trophic, defence and metabolic niche dimensions based on schemes adapted respectively from Holdridge (1967), Winemiller & Rose (1992), Wakefield et al. (2005), Feeny (1976), and Reich et al. (1997); and (b) a hypothetical classification tree, with the thick blue line representing a species entry for category H3,L3,T2,D1,M2 and dashed lines representing niche dimensional combinations unobserved in nature.
