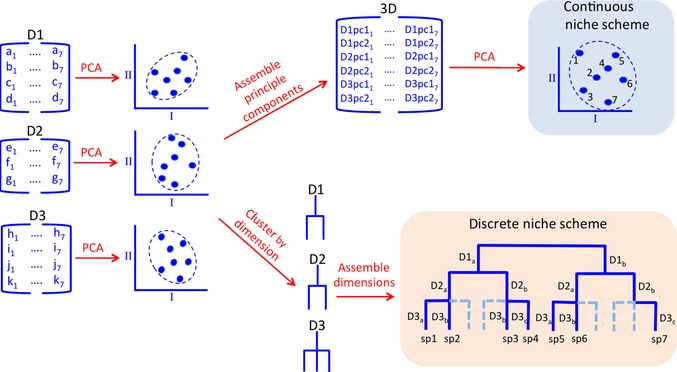
Figure 4.

Schematic diagram for a general methodology for creating discrete and continuous niche schemes. D1, D2 and D3 are trait data matrices associated with three different niche dimensions involving a set of seven species. PCA axes I and II are dominant gradients of trait combinations derived from analyses performed on each data set separately. The continuous scheme derives from multivariate analysis using species loadings for the dominant axes from each dimensional analysis as input data. The discrete scheme is a niche classification derived from a cluster analysis, such as classification and regression tree, using interspecific distances based on species loadings from the continuous niche scheme and raw data for each niche dimension for classification. In practice, traits data would need to be standardised, data sets and steps in the process would need to be quality assured, and, in the case of the discrete scheme, clustering thresholds would need to be optimised for the intended use of the classification.
