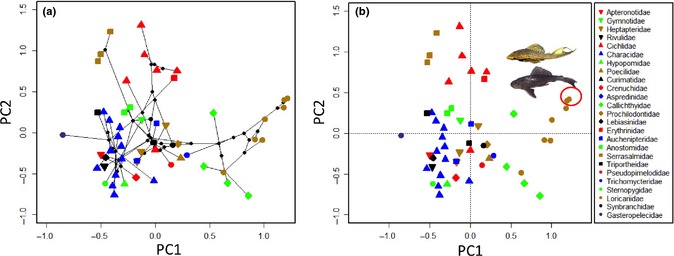
Figure 5.

Example of a continuous niche scheme, a two‐dimensional ordination plot of tropical fish species based on analysis of 5‐dimensional niche space (i.e. PCA performed using species loadings on the two dominant axes from each of five separate PCAs). (a) Species plotted with symbols representing families, with network of lines representing phylogenetic relationships of species comprising the local assemblage and the length of each line representing the niche branch length between species or species and inferred ancestral nodes (method follows Sidlauskas 2008). (b) Species plotted with symbols as in (a) but without phylogenetic relationships and showing the location of two South American fishes that are invasive in the Southern U.S. and Mexico.
