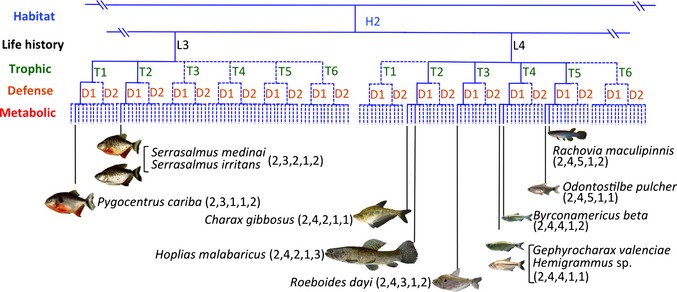
Figure 6.

Example of a discrete niche classification scheme, dendrogram derived from classification and regression tree analysis. Species PC1 and PC2 scores were used as grouping criteria, and functional trait values associated with each niche dimension were the basis for bifurcations creating branching structure. Only a portion of the full dendrogram is shown here (remaining portions appear in Figs S19–S22). Each of two niches is occupied by two species, other niches are occupied by one species, and most potential trait combinations are unobserved in this diverse fish assemblage.
