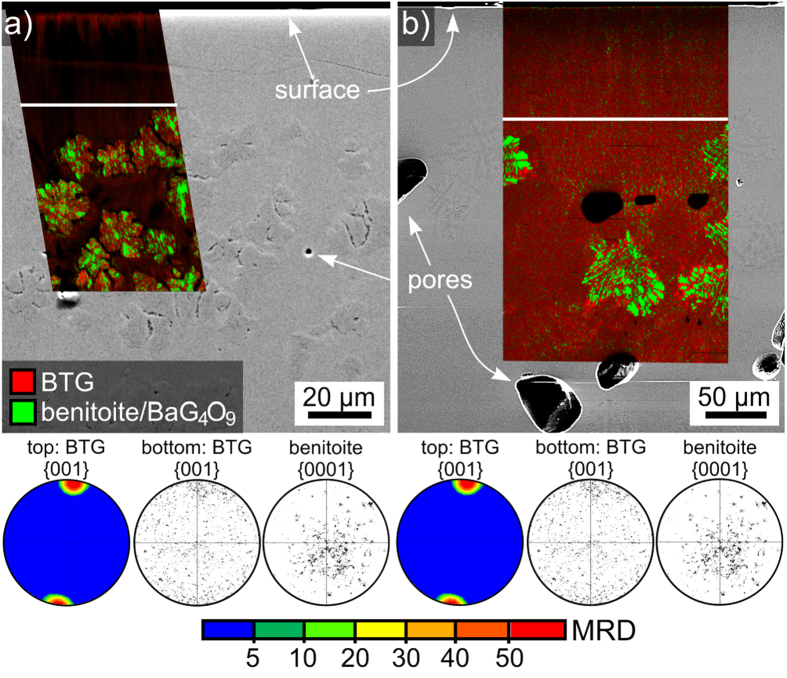
Figure 14.
SEM-micrographs of cross sections prepared from samples of glass 2 annealed (a) at 690 °C for 12 h and (b) at 970 °C for 10 h. Phase+IQ-maps of EBSD-scans performed on the respective areas are superimposed on the micrographs. PFs of textures calculated for BTG from filtered data sets of much larger scans are presented for the top layer of surface crystallization while PFs of both BTG and benitoite are presented for the bottom parts of the scans representing the bulk crystallization.

