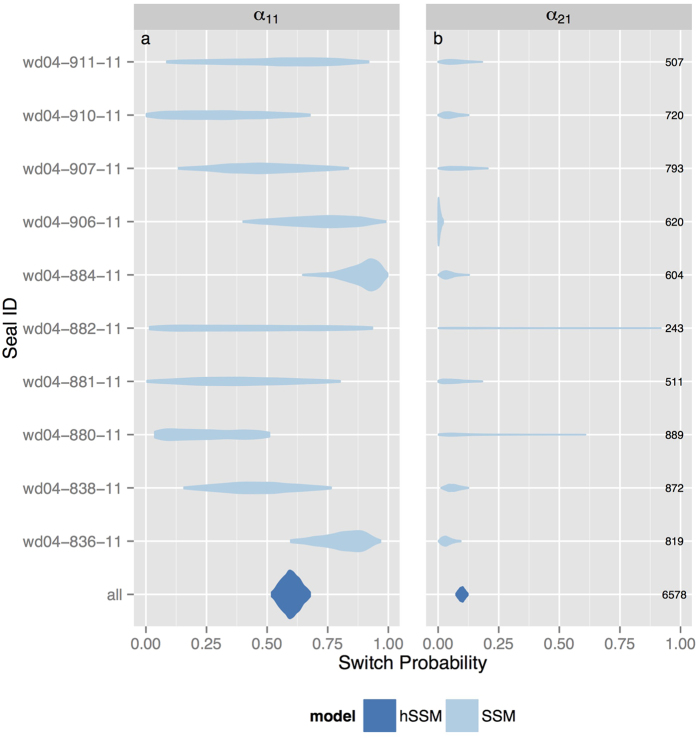
Figure 2. Violin plots of the posterior distributions (95% Highest Posterior Density Interval) for the behavioural state switching probabilities (a)  and (b)
  .
.
These parameters were estimated separately for each of the 10 Weddell seals via the SSM and across seals via the hSSM.  is the probability of remaining in the transient state and
  is the probability of switching from the ARS state to the transient state. Track sample sizes are displayed at right in (b). Violin heights are scaled to have equal areas within panels.

