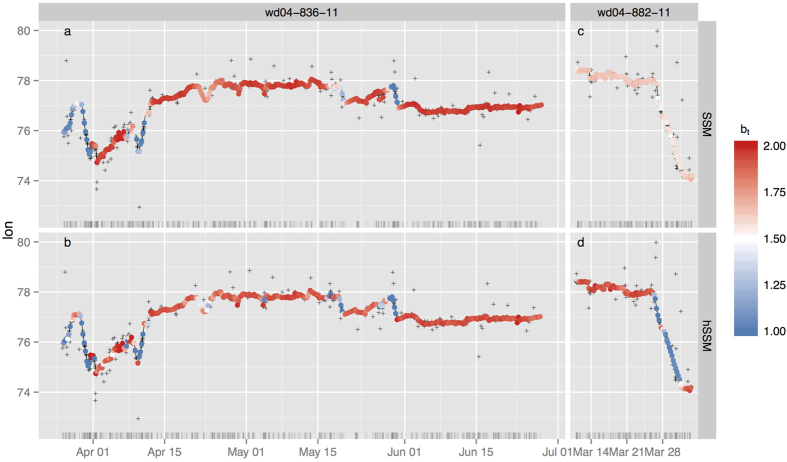
Figure 3. Posterior mean longitude time-series coloured by the posterior mean behavioural state for seals wd04-882-11 (a,b) and wd04-836-11 (c,d).
Panels (a–c) are estimates from the SSM and panels (b–d) are estimates from the hSSM. Longitudes in (a,b) are shifted −2.5° to lie within the range of (c,d), allowing better visualisation of behavioural state transitions across both seals. The grey + symbols display the observed longitudes and the rug along the x-axis denotes their time sequence.

