Figure 3.

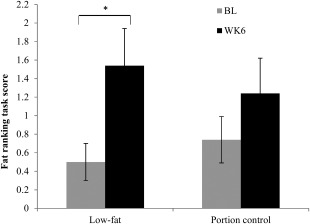
Mean ± SEM fat ranking scores at baseline (BL) and week 6 (WK6) for the LF (n = 26) and PC (n = 27) diet groups. *P < 0.05 using Wilcoxon signed‐Rank tests.

Mean ± SEM fat ranking scores at baseline (BL) and week 6 (WK6) for the LF (n = 26) and PC (n = 27) diet groups. *P < 0.05 using Wilcoxon signed‐Rank tests.