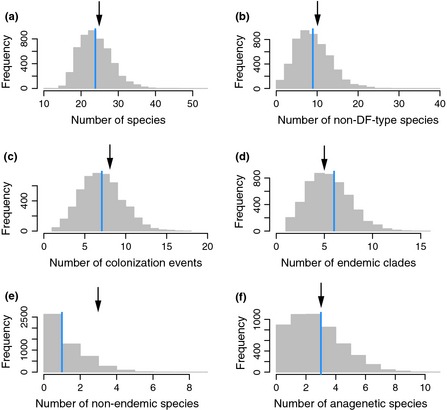
Figure 4.

Goodness of fit of the M8 model. Histograms show the number of (a) total species, (b) non‐DF‐type species, (c) colonisation events, (d) endemic clades, (e) non‐endemic clades and (f) anagenetic species in the 5000 phylogenetic data sets simulated with the ML parameters of the M8 model. Blue vertical lines indicate median values across simulated data sets and black arrows indicate the observed values in the Galápagos data.
